Norovirus (NoV) is a causative agent of acute gastroenteritis. NoV binds to histo-blood group antigens, namely ABH antigens and Lewis antigens, in which type 1 and type 2 carbohydrate core structures constitute antigenically distinct variants. Type 1 carbohydrates bind more tightly to NoV than the type 2 carbohydrates. Surface plasmon resonance assay to measure the binding specificity and relative affinity of NoV virus-like particles (VLPs) to synthetic histo-blood group carbohydrates interactions is described in this paper. |
| Category | Roles of glycans during microbial infection |
| Protocol Name | Surface plasmon resonance assay to measure binding specificity and relative affinity between Norovirus and synthetic histo-blood group carbohydrates. |
Authors
 |
Shirato, Haruko
Department of Virology II, National Institute of Infectious Diseases
|
| KeyWords |
|
Reagents
 |
| ● |
Monovalent carbohydrate-biotin reagent |
| ● |
Running buffer: 20 mM Tris-HCl, pH 7.4, 150 mM NaCl, 2 mM MgCl2, and 2 mM CaCl2 containing 0.005% Surfactant P20 (Biacore AB, Uppsala, Sweden) |
|
Instruments
 |
| ● |
Research-grade streptavidin-coated sensor chip (Biacore AB) |
| ● |
Biacore 2000 instrument (Biacore AB) |
|
| Methods |
|
1. |
Surface plasmon resonance assay to measure binding specificity and relative affinity between Norovirus and synthetic histo-blood group carbohydrates. |
| 1) |
Pretreate a streptavidin-coated sensor chip with three injections of 1 M NaCl/50 mM NaOH at a flow rate of 5 μL/min/injection. |
Comment 0
|

|
| 2) |
Rehydrate the monovalent carbohydrate-biotin reagent to 1 mg/mL with 0.3 M sodium phosphate buffer, and dilute to 10 fmol/μL with the same buffer. |
Comment 0
|
|
|
| 3) |
Inject the 10 fmol/μL solution of each biotinylated oligosaccharide at a flow rate of 5 μL/min until an optimal amount of the glycan is captured on each independent surface of the sensor chip. |
Comment 0
|
|
|
| 4) |
Inject the VLPs (100 μg/mL) in the running buffer at a flow rate of 20 μL/min for 120 sec over all surfaces of the sensor chip to monitor the associations between VLPs and oligosaccharides. |
Comment 0
|
|
|
| 5) |
Replace the VLPs with the running buffer to monitor their dissociations. |
Comment 0
|
|
|
| Notes |
- The carbohydrate-free surface of a sensor chip was used as a negative control.
- A signal of 100 RU corresponds approximately to a surface concentration change of 0.1 ng/mm2.
- VLPs can be handled in a facility with Biological Safety Level of 1.
|
| Figure & Legends |
Figure & Legends 
Copyright © American Society for Microbiology, Journal of Virology, 82(21), 2008, 10756-10767, doi:10.1128/JVI.00802-08.
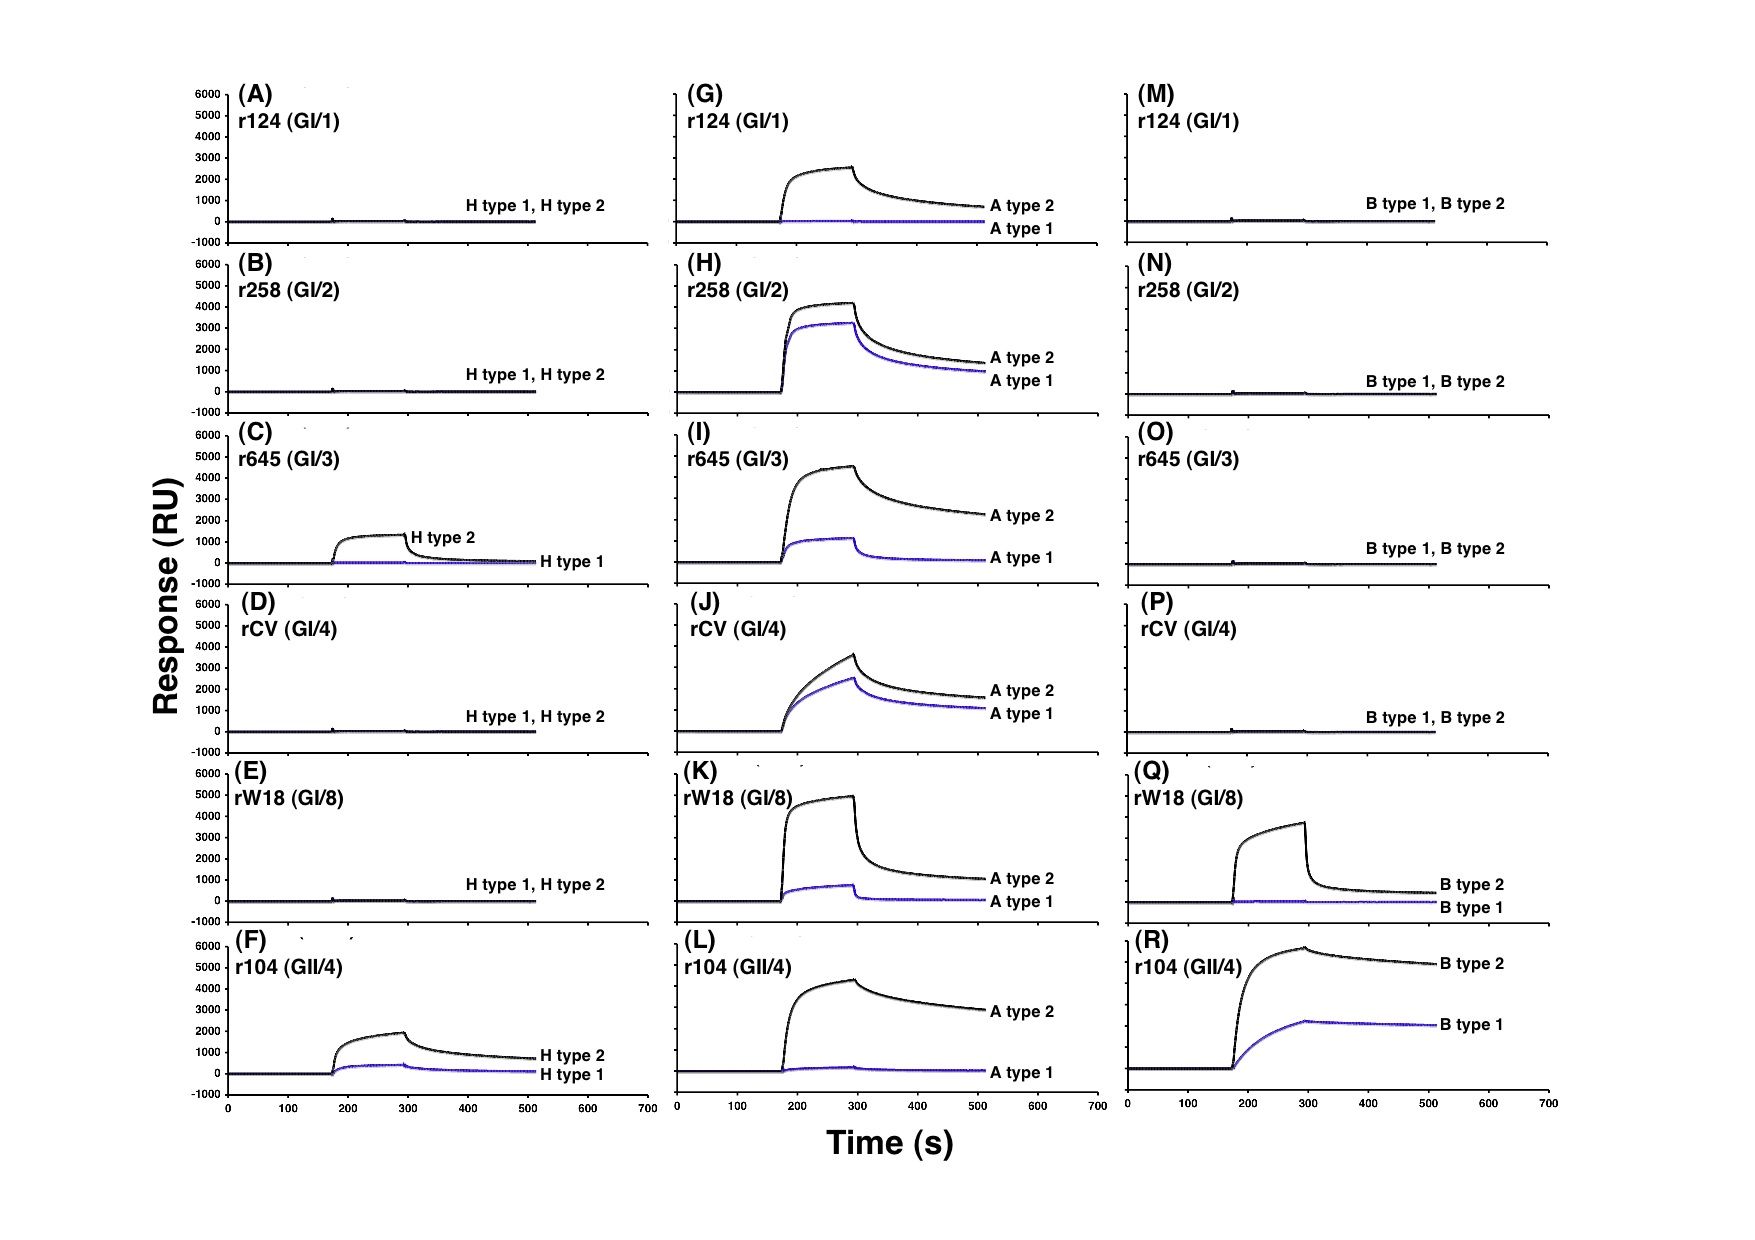
Fig. 1.
SPR Biacore experiments to determine the level of binding between NoV VLPs and either type 1 or type 2 carbohydrate chains. Sensorgrams show the binding of 6 VLPs, including GI/1-4, GI/8 and GII/4, to immobilized carbohydrates, H type 1 and type 2 (A-F), A type 1 and type 2 (G-L), and B type 1 and type 2 (M-R). At 180 sec, 40 μL of the VLP was injected at a flow rate of 20 μL/min, and then replaced by the running buffer at 300 sec. The binding curves of 180–300 sec showed the association, whereas those of 300–500 sec showed the dissociation. The binding curves between VLPs and two different carbohydrates were compared by overlaying the sensorgrams obtained on each surface. The ordinate indicates the resonance signal in resonance units (RU).
|
| Copyrights |
Copyright 2008. American Society for Microbiology, for a figure in [Figure & Legends].
Copyright 2011. Ritsumeikan University, JCGGDB & AIST. for the rest of the contents. |
| Date of registration:2015-01-22 13:38:08 |
- Nam, H.J., Gurda-Whitaker, B., Gan W.Y., Ilaria S., McKenna, R., Mehta, P., Alvarez, R.A., and Agbandje-McKenna, M. (2006) Identification of the sialic acid structures recognized by minute virus of mice and the role of binding affinity in virulence adaptation. J Biol Chem. 281, 25670–25677 [PMID : 16822863]
- Shirato, H., Ogawa, S., Ito, H., Sato, T., Kameyama, A., Narimatsu, H., Xiaofan, Z., Miyamura, T., Wakita, T., Ishii, K., and Takeda, N.. (2008) Noroviruses Distinguish between Type 1 and Type 2 Histo-Blood Group Antigens for Binding. J. Virol., 82, 10756–10767 [PMID : 18701592]
|
|
For those who wish to reuse the work, please contact JCGGDB management office (jcggdb-ml@aist.go.jp).
|
|
