An estimate of the structure of a glycan analyte can be made by comparing its MSn spectra with that of various glycans in the Glycan Mass Spectral Database (GMDB). MSn spectra can be compared by the following protocol of MSn spectral acquisition described here. |
| Category | Isolation & structural analysis of glycans |
| Protocol Name | Glycan Analysis by MSn Spectral Matching |
Authors
 |
Kameyama, Akihiko
Biotechnology Research Institute for Drug Discovery, Department of Life Science and Biotechnology, National Institute of Advanced Industrial Science and Technology (AIST)
|
| KeyWords |
|
Reagents
 |
| ● |
2,5-Dihydroxybenzoic Acid, proteomics grade (Wako Pure Chemical Industries Ltd., Osaka, Japan) |
| ● |
Water, Ultrapure for LC/MS (Wako Pure Chemical Industries Ltd.) |
| ● |
Ethanol, for HPLC (Wako Pure Chemical Industries Ltd.) |
|
Instruments
 |
| ● |
MALDI-QIT-TOF mass spectrometer equipped with an Ultra Cooling Kit (AXIMA-QIT; Shimadzu Corp., Kyoto, Japan) |
| ● |
GMDB (URL: http://jcggdb.jp/rcmg/glycodb/Ms_ResultSearch) |
|
| Methods |
|
1. |
Protocol of MSn Spectra Acquisition |
| 1) |
Place 0.5 μL of a sample solution* onto a target plate (specular surface stainless steel plate, 2 mm diameter) and allow it to dry.
* To obtain reliable data, the sample solution should contain analyte glycan at a concentration of 0.5–2.0 pmol/μL. In addition, the analyte needs to be desalted. |
Comment 0
|

|
| 2) |
Cover the dried analyte on the target plate with 0.5 μL of the matrix solution (10 mg/mL of 2,5-dihydroxybenzoicacid in 30% ethanol) and allow it to dry. |
Comment 0
|
|
|
| 3) |
Recrystallize the dried material by adding 0.15 μL of 99.5% ethanol to the matrix-analyte mixture on the target plate. |
Comment 0
|
|
|
| 4) |
Acquire a MS spectrum of the analyte in positive ion mode. |
Comment 0
|
|
|
| 5) |
Acquire MS2 spectra of sodium adductions* derived from the glycan analytes. For the acquisition of CID spectra, adjust the CID energy so that the signal of the precursor ion almost disappears. If the intensity of the precursor ion in the spectrum is more than 15% of the base peak, the spectrum must be discarded and reacquired with a larger CID energy. Use an automatic acquisition function** with a regular raster that governs the laser shot patterns.
*Dope 0.5 μL of 10 mM NaCl solution onto the dried analyte when proton adduct ions are predominant.
**Automated acquisition is critical for obtaining reliable data. |
Comment 0
|
|
|
| 6) |
Search for candidate structures of the analyte glycan using GMDB. |
Comment 0
|
|
|
| 7) |
Compare the spectra of the glycan analyte and the various candidates. |
Comment 0
|
|
|
| 8) |
Sometimes multiple spectra display similarity to the analyte MS2 spectra. In such cases, manually find signals that can be used to distinguish the spectra by comparing their MS3 spectra. |
Comment 0
|
|
|
| 9) |
Acquire MS3 spectra of the signals in the MS2 spectra using the same procedure as described above for MS2 acquisition (#5). |
Comment 0
|
|
|
| 10) |
Compare the MS3 spectra between analyte glycan and the candidates. |
Comment 0
|
|
|
|
2. |
|
| 1) |
Click a link for “m/z” on the left hand column in the top page. |
Comment 0
|
|
|
| 2) |
Input m/z value of a precursor ion of your MS2 spectrum, and enter an appropriate value* in the box of “tolerance”.
*The appropriate value is generally from 0.5 to 1.0. |
Comment 0
|
|
|
| 3) |
Click a “Search” button. (Fig. 1) |
Comment 0
|
|
|
| 4) |
“Search Result” window will open. Relevant glycan structures are shown with a tree-structured list of m/z values of precursor ions, in which relevant precursor ions are highlighted in yellow. |
Comment 0
|
|
|
| 5) |
Click the m/z values of MS2 precursor in the tree-structured list. |
Comment 0
|
|
|
| 6) |
Click the button “Show Spectra”. (Fig. 2) |
Comment 0
|
|
|
| 7) |
The spectral images appear with the corresponding glycan strucures in the “Spectrum” window. (Fig. 3) |
Comment 0
|
|
|
| 8) |
Where multiple spectra show similarity to the analyte MS2 spectra, go back to the “Search Result” window and click the m/z values of MS3 precursor in the tree-structured list of candidates. Find the precursor ions that can be used to discriminate the spectra by comparing their MS3 spectra. |
Comment 0
|
|
|
| 9) |
Click the button “Show Spectra”. |
Comment 0
|
|
|
| Notes |
Ideally, analyte glycans are isolated prior to MSn spectra acquisition. In particular, isomers must be separated. Analyte glycans should be derivatized to particular forms as stored in GMDB. N-linked glycans should be labeled with 2-aminopyridine (PA). O-Linked glycans are converted to the corresponding alditols. For other types of glycans, please consult to GMDB. However, GMDB is not a comprehensive resource. Therefore, please remember that your analyte glycan may not exist in GMDB. In such cases, other methods, for example glycosidase digestion or 2D-HPLC mapping should be combined with this methodology. |
| Figure & Legends |
Figure & Legends 
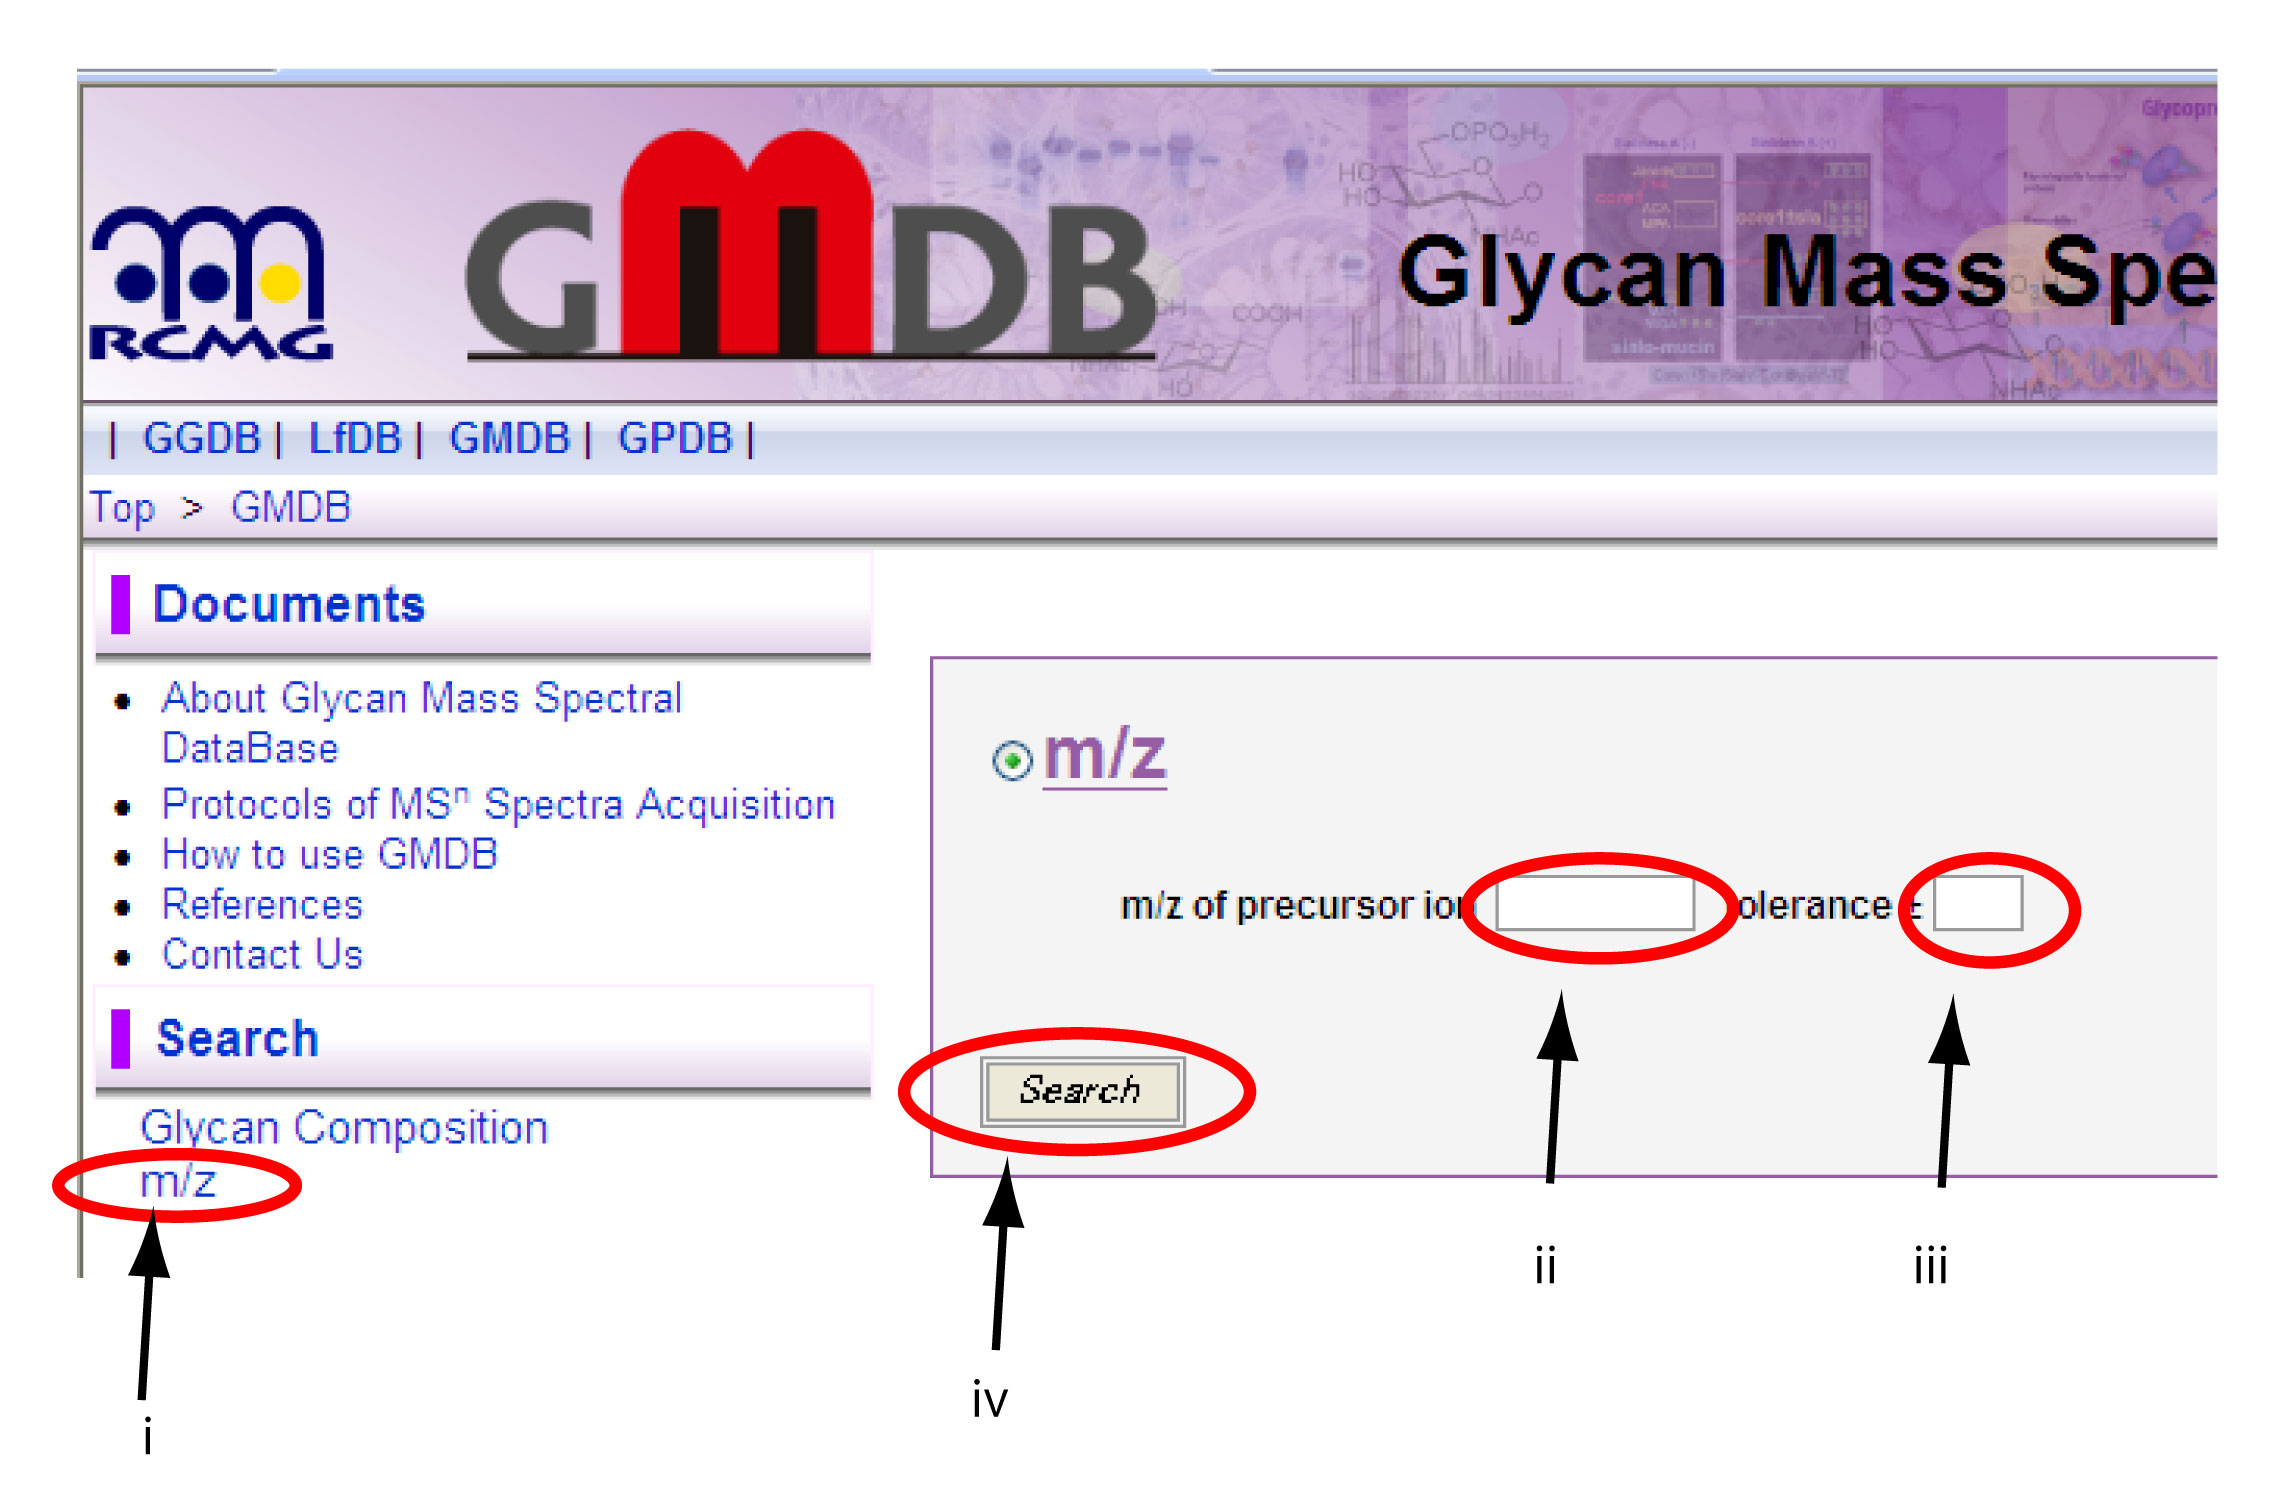
Fig. 1. Search window for m/z in GMDB
Clicking “m/z” on the left column (i), m/z search window will appear on the right hand side. input m/z value (ii) and tolerance (iii) of your precursor ion in the corresponding boxes. Then, press the “Search” button.
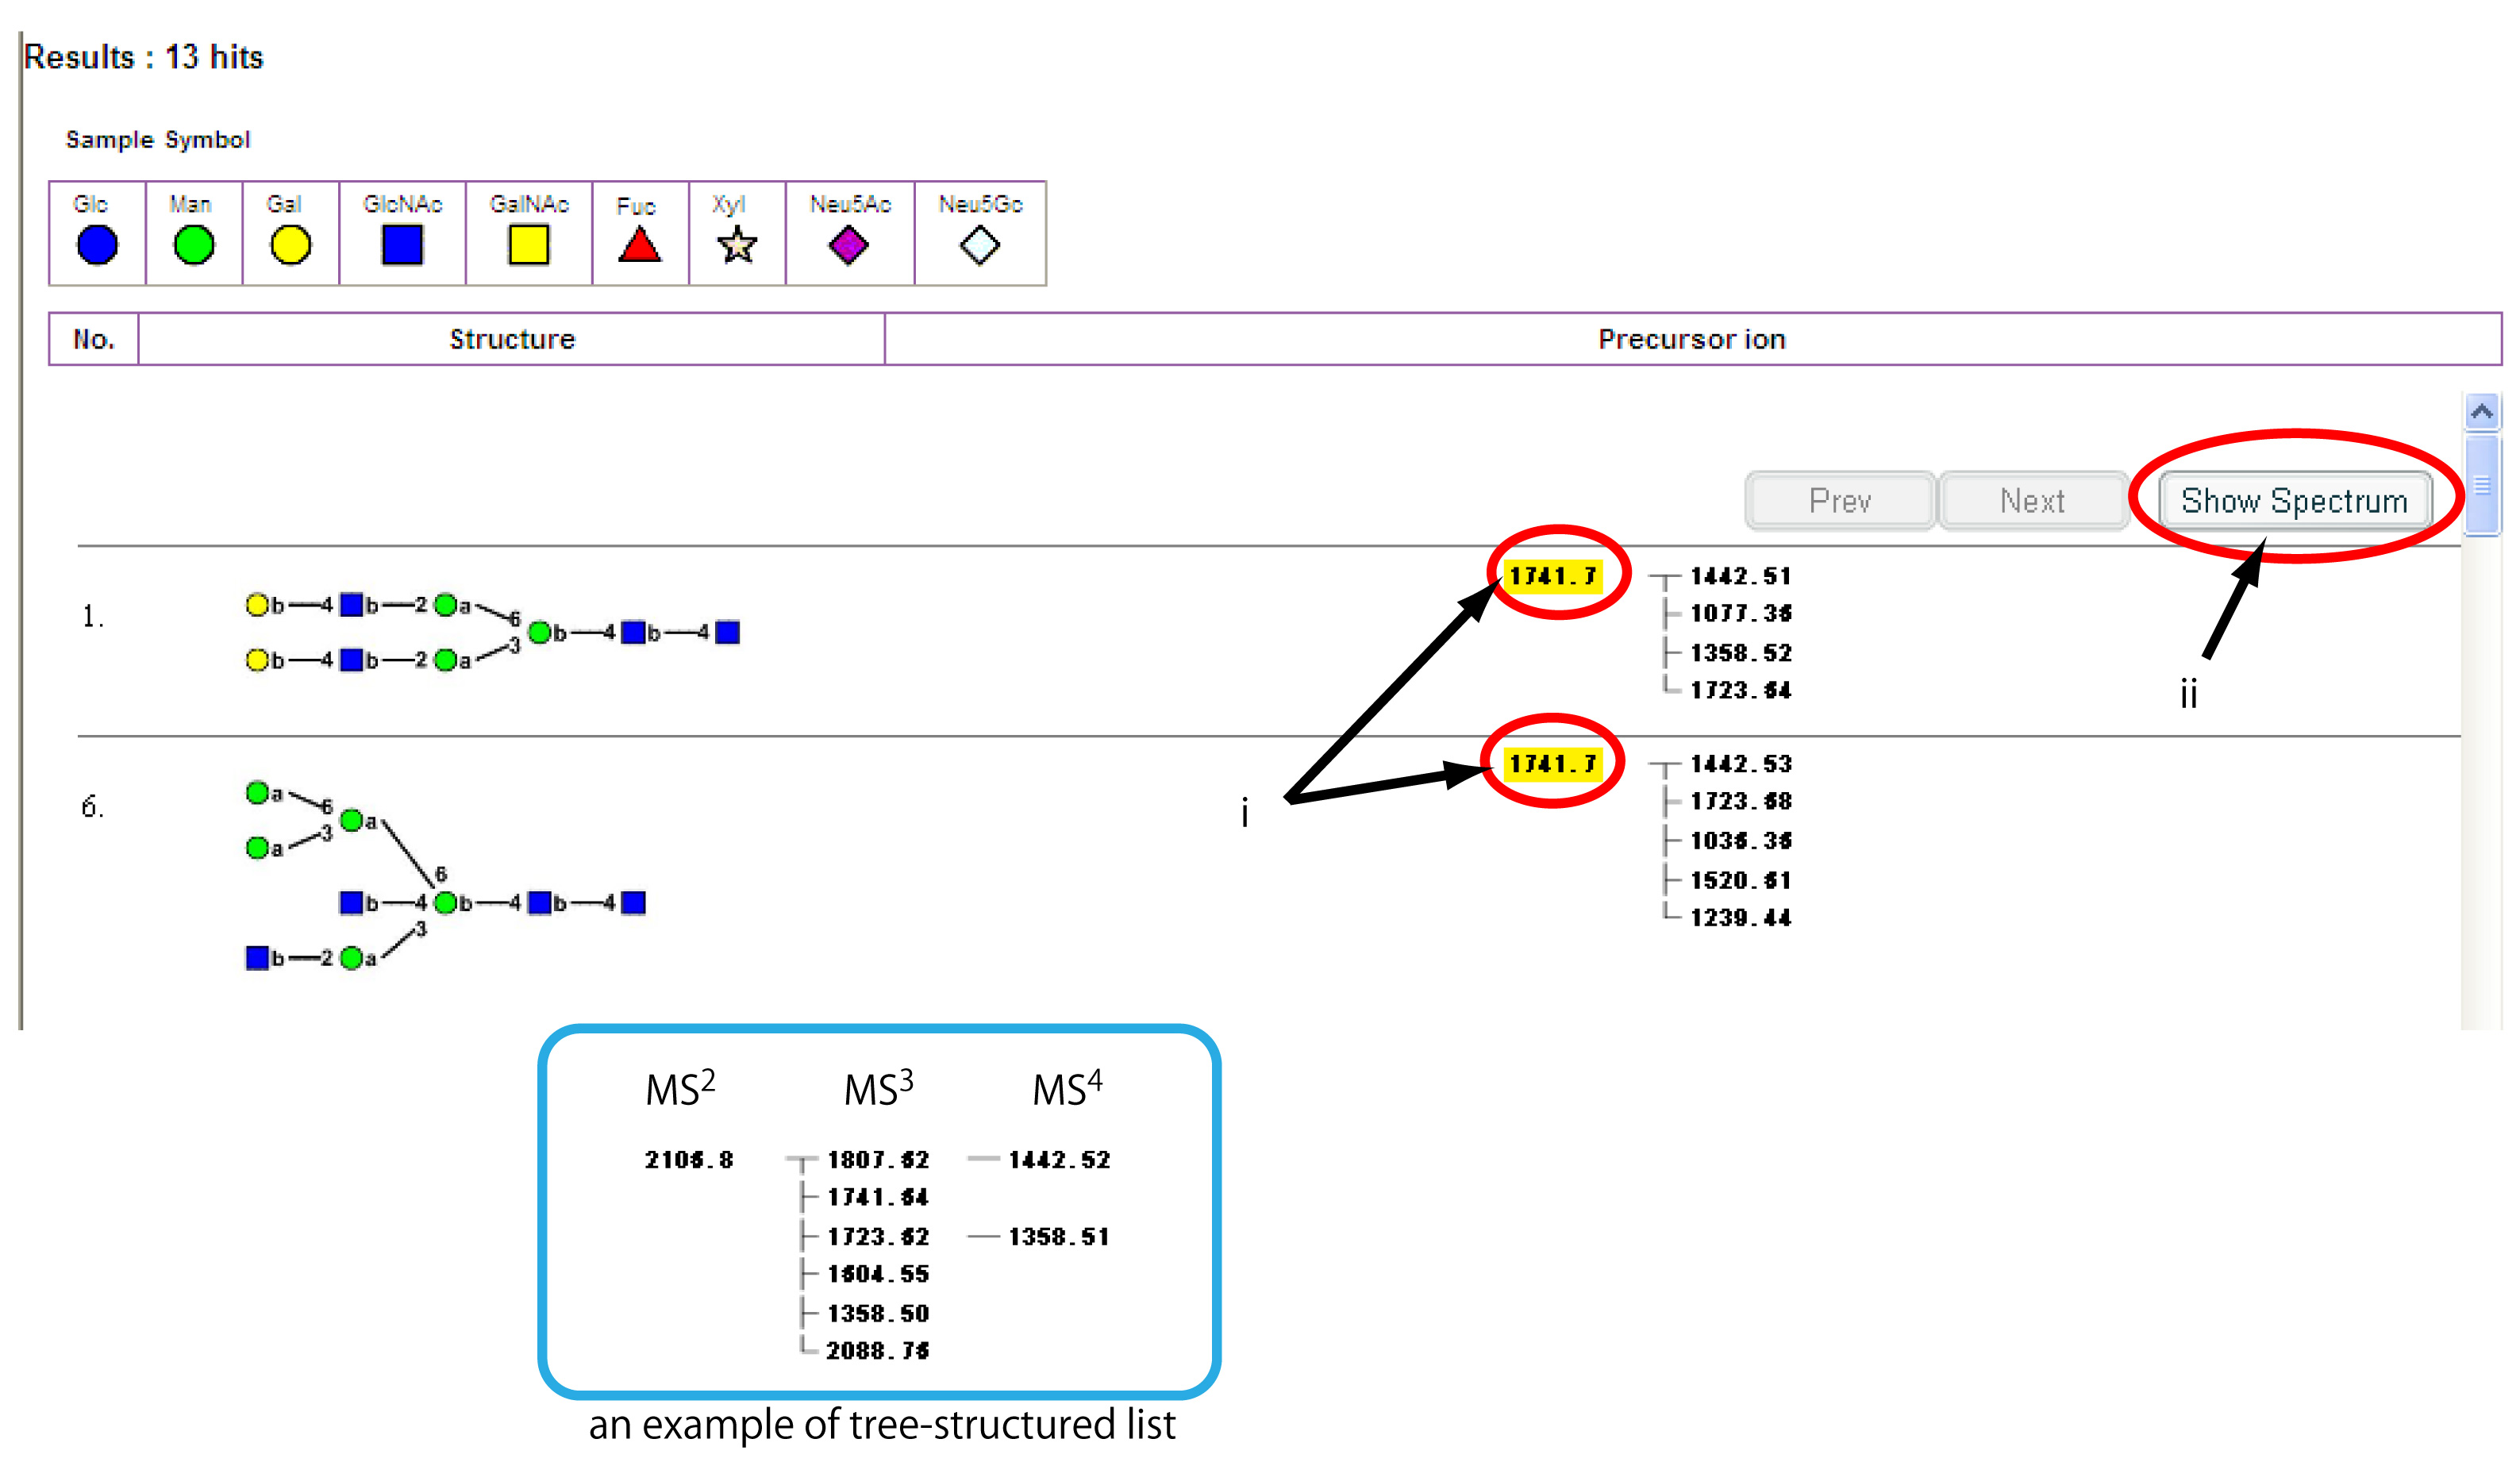
Fig. 2. An example of the search result window
The list of glycans which have MSn spectra of the queried m/z value is shown in the window. The precursor ions of the stored MSn spectra for each glycan are depicted as a tree-structured list. Click precursor ions of the MSn spectra you want to view. The numbers are highlighted in yellow (i). Then, press the “Show Spectrum” button.
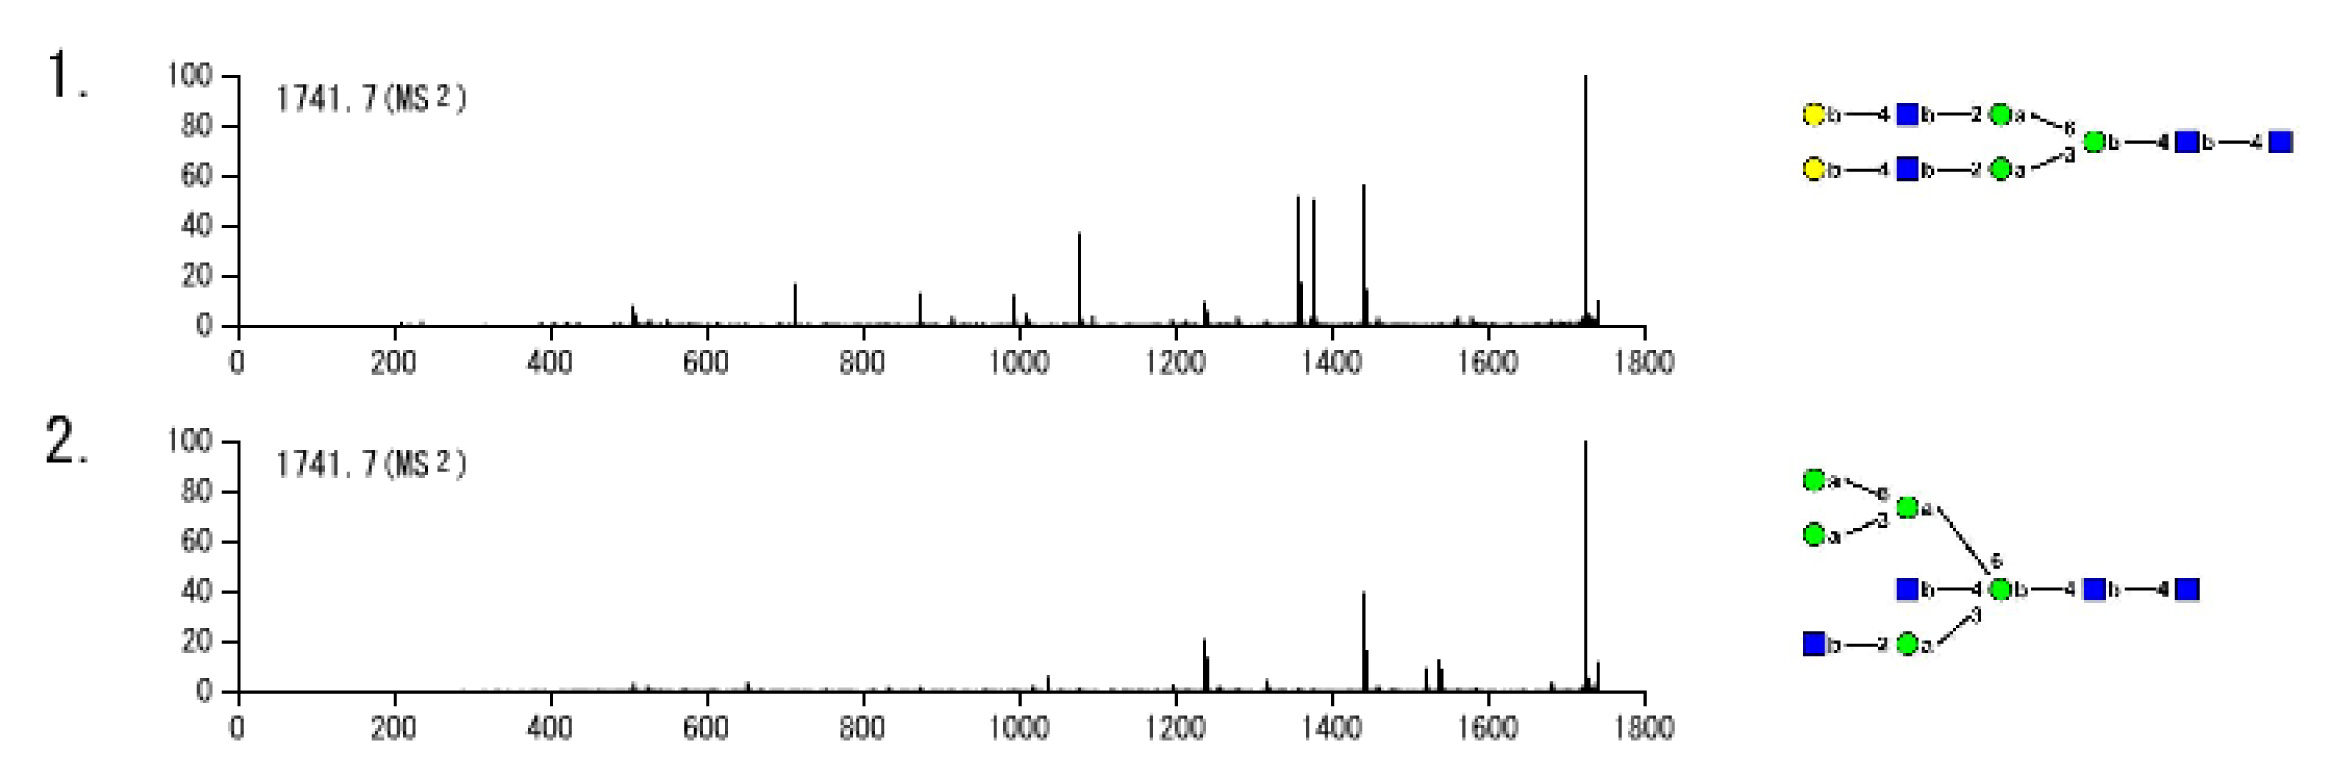
Fig. 3. Example of spectrum window
MSn spectra you selected are shown along with their glycan structures. You can easily compare these spectra in the window.
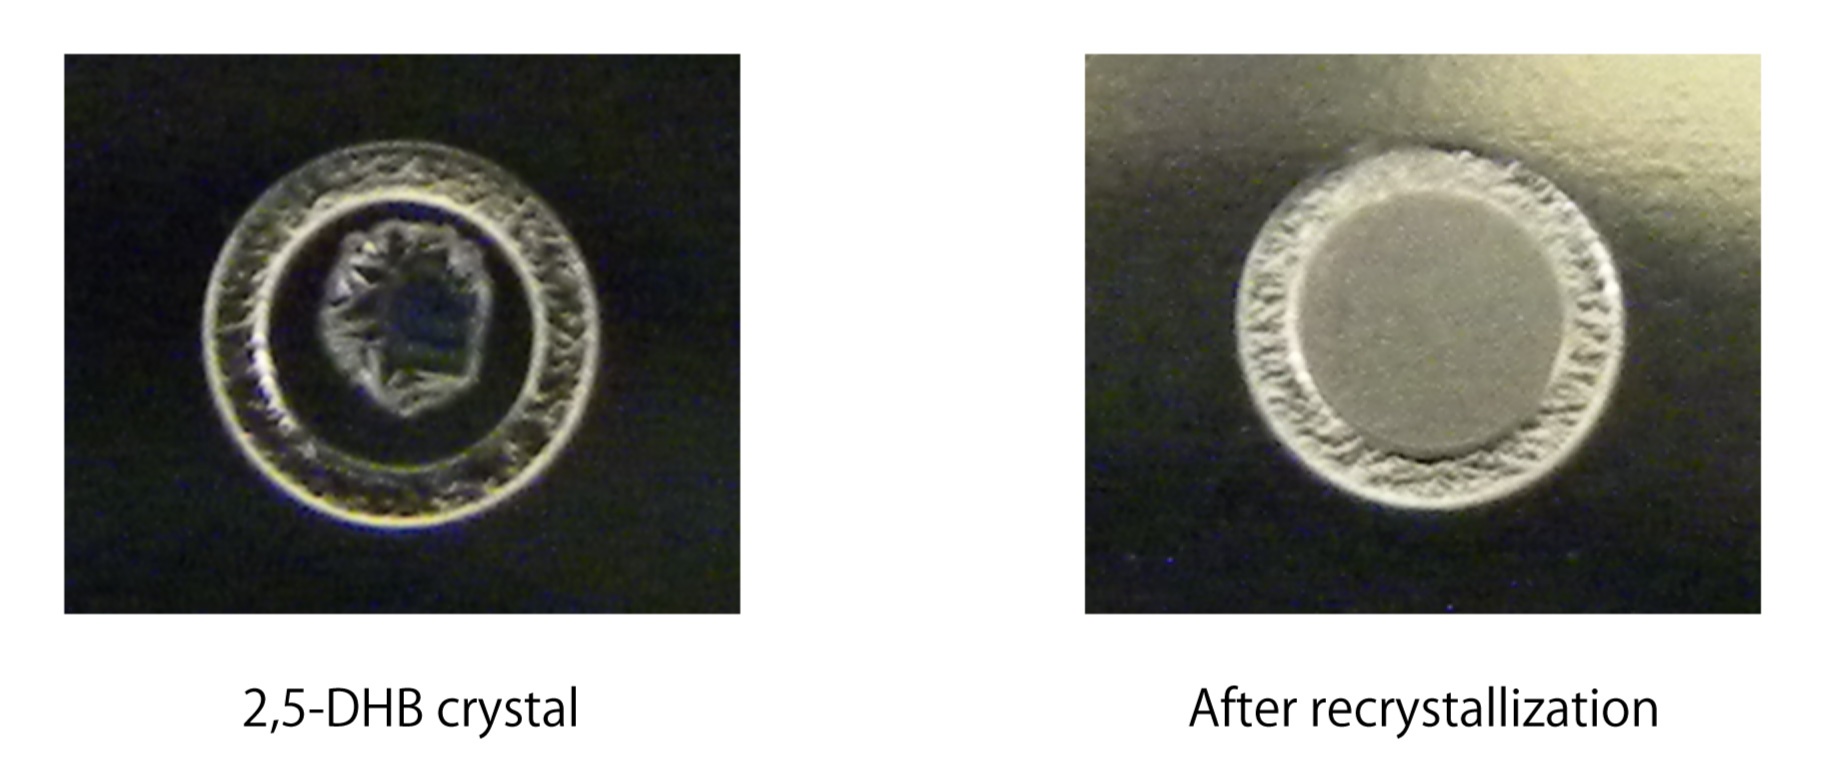
Fig. 4. Image of the recrystallized 2,5-DHB on a target plate
Needle shaped crystal (left) of 2,5-DHB is transformed to a small granule crystal (right) by adding ethanol. The recrystallized 2,5-DHB is sufficiently homogeneous to obtain MS spectra by automated acquisition. |
| Copyrights |
 Attribution-Non-Commercial Share Alike Attribution-Non-Commercial Share Alike
This work is released underCreative Commons licenses
|
| Date of registration:2014-06-19 13:45:22 |
- Kameyama, A., Kikuchi, N., Nakaya, S., Ito, H., Sato, T., Shikanai, T., Takahashi, Y., Takahashi, K., and Narimatsu, H. (2005) A strategy for identification of oligosaccharide structures using observational multistage mass spectral library. Anal. Chem. 77, 4719–4725 [PMID : 16053281]
- Kameyama, A., Nakaya, S., Ito, H., Kikuchi, N., Angata, T., Nakamura, M., Ishida, HK., Narimatsu, H. (2006) Strategy for simulation of CID spectra of N-linked oligosaccharides toward glycomics. J. Proteome Res. 5, 808–814 [PMID : 16602687]
|
This work is licensed under Creative Commons Attribution-Non-Commercial Share Alike. Please include the following citation
How to Cite this Work in an article:
Kameyama, Akihiko,
(2014). GlycoPOD https://jcggdb.jp/GlycoPOD.
Web.20,4,2024 .
How to Cite this Work in Website:
Kameyama, Akihiko,
(2014).
Glycan Analysis by MSn Spectral Matching.
Retrieved 20,4,2024 ,
from https://jcggdb.jp/GlycoPOD/protocolShow.action?nodeId=t1.
html source
Kameyama, Akihiko,
(2014).
<b>Glycan Analysis by MS<sup>n</sup> Spectral Matching</b>.
Retrieved 4 20,2024 ,
from <a href="https://jcggdb.jp/GlycoPOD/protocolShow.action?nodeId=t1" target="_blank">https://jcggdb.jp/GlycoPOD/protocolShow.action?nodeId=t1</a>.
Including references that appeared in the References tab in your work is
much appreciated.
For those who wish to reuse the figures/tables, please contact JCGGDB
management office (jcggdb-ml@aist.go.jp).
|
|
